Graduate Outcomes data and statistics from the class of 2021/22
13 June 2024
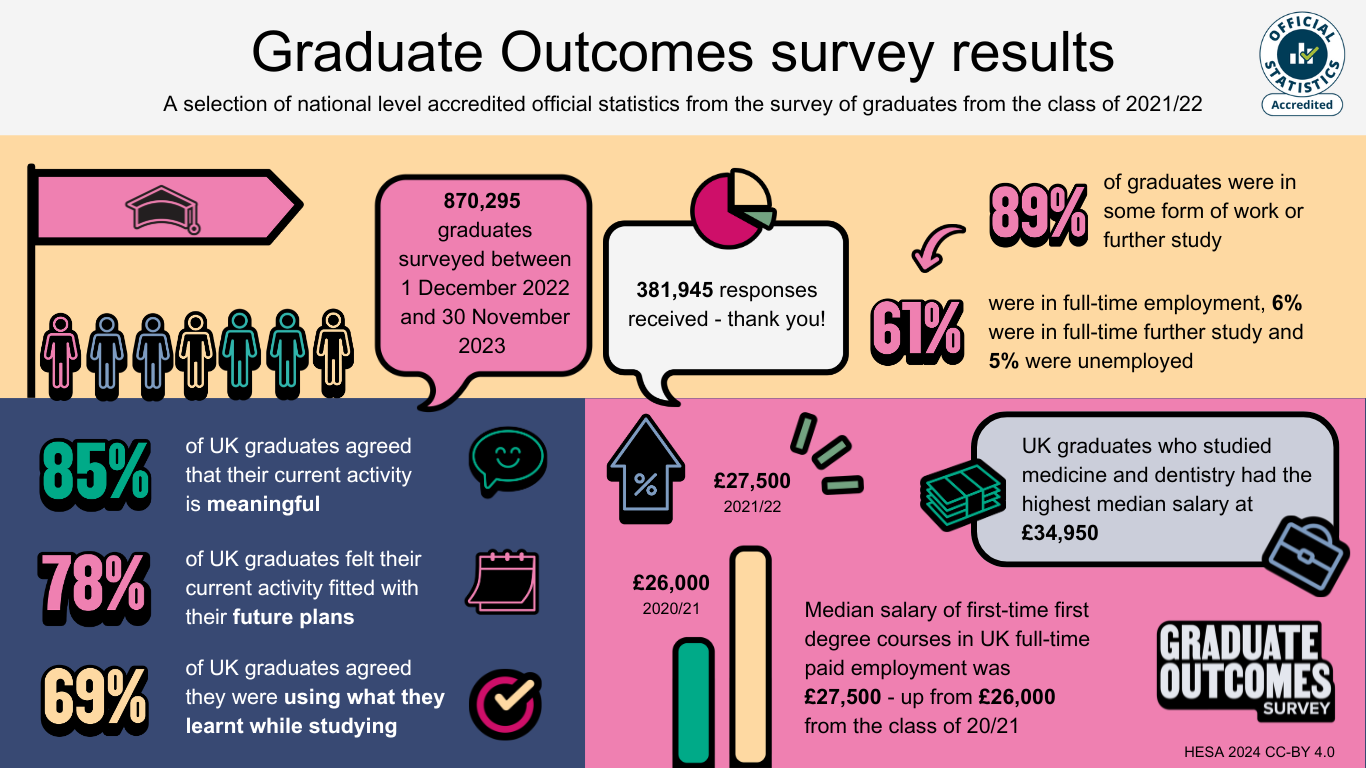
89% of graduates who responded to the 2021/22 Graduate Outcomes survey were in some form of work or further study. 77% responded that their activity fit with their future plans.
83% of graduates from the 2021/22 academic year were in employment, unpaid work, or a mixture of work and study, 15 months after graduation. 61% were in full-time employment, 6% were in full-time further study and 5% were unemployed1.
Among UK domiciled graduates who studied at undergraduate level, 51% of Asian graduates were in full-time employment compared to 59% of White graduates. 9% of Asian graduates were unemployed compared to 5% of White graduates2.
83% of UK domiciled undergraduates agreed that their activity at the time of the survey was meaningful. 75% agreed that it fit with their future plans and 65% agreed that they were using what they had learned during their studies. Unemployed graduates were less likely to agree with those statements3.
The median salary of UK domiciled graduates from full-time first degree courses in full-time paid employment was £27,500 compared to £26,000 the year before. Graduates who studied medicine and dentistry had the highest median salary at £34,9504.
Graduate Outcomes is the largest annual social survey in the UK with 870,295 graduates eligible to take part in the 2021/22 survey. 381,945 graduates provided usable responses giving a response rate of 44%5. The survey asks graduates about their activities approximately 15 months after graduation.
Today’s release carries the brand new “accredited official statistics” kitemark from the Office for Statistics Regulation (OSR). The OSR report confirmed that Graduate Outcomes data and its publication demonstrate a commitment to principles of trustworthiness, quality and value. Their report highlighted response rates as a strength of the Graduate Outcomes survey when compared to other large social surveys.
Today’s accredited official statistics include high-level national figures and more detailed open data. These include breakdowns by HE provider, subject of study, personal characteristics, and type of employment or further study.
To view a selection of statistics in infographic style, visit our survey results page.
Notes
- See Figure 1
- See Figure 5
- See Figure 18
- See Figure 14 – note that salary data is not adjusted for inflation.
- See Summary
- See Definitions: Graduate Outcomes for full definitions of terms used in the release and explanation of the coverage of statistics.
- See Graduate Outcomes user guide for guidance on the background, methodology, and available resources for users of the Graduate Outcomes survey.
- See Upcoming data releases for a schedule of Official Statistics releases from HESA.
- HESA is part of Jisc. Jisc cannot accept responsibility for any inferences or conclusions derived from the data by third parties.
Blogs
Privacy information Cookie policy Accessibility statement
"Graduate Outcomes” is a registered trademark owned by Jisc

